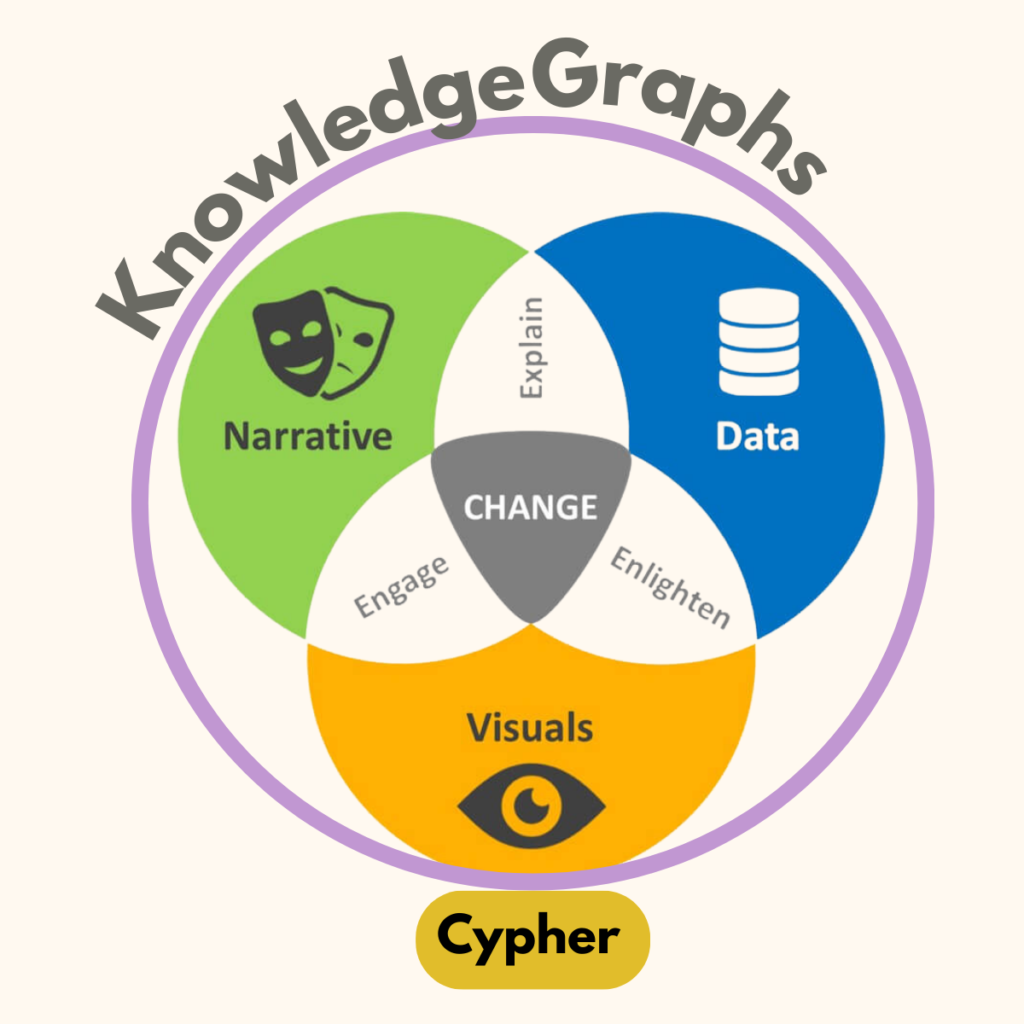
Gartner predicts that data storytelling will dominate Business Intelligence (BI) by 2025, with 75% of these stories narrated by AI. This got me thinking: What drives the generation of these stories? How is the narrative produced?

As a Knowledge Graph Enthusiast, it became clear to me that knowledge graphs are the key to this evolution. They inherently possess all the elements needed for compelling data storytelling:
- Relationships as Storyline Breadcrumbs: Knowledge graphs encapsulate relationships between data points, creating a natural flow for narratives.
- Data Integration: With data and its relationships already mapped, knowledge graphs provide a robust foundation for story generation.
- Ontology as the Narrative: It inherently forms the narrative framework.
- Visualization: Knowledge graphs offer intuitive and insightful visualizations, making data stories more engaging and understandable.
In essence, knowledge graphs naturally encompass the entire data storytelling toolkit. The future of data-driven storytelling lies in leveraging the power of knowledge graphs to craft insightful, coherent, and compelling stories.
As I experimented with knowledge graphs and turned Chat GPT-4o into a narrative agent, I was fascinated by the power of this combination. With a simple hint to the LLM to “craft stories based on the knowledge graph,” the story was generated, and importantly, it was linked to facts derived from the graph.
The knowledge graph allows room for generativeness while maintaining factual accuracy.
Truly unbelievable.
I also discovered that we should change how we think of Cypher. It’s a tool of storytelling wonder. In the coming posts, I’ll demonstrate that.